Case Study: Vehicle to Vehicle Communication
Summary
DIMO is a connected car network that puts drivers back in control of their car data. With over 100k cars connected across the United States, Canada and Europe, there are instances of connected cars being within 150 meters of each other. As the network expands with cars, the instances of nearness will only increase enabling vehicle to vehicle (V2V) communication. This opens the door to exciting opportunities, including further decentralization of DIMO, proof of location, and improvement to transportation that could aid in autonomous driving smart cities.
Why V2V Communication Matters?
Improving Transportation & Aiding Autonomous Driving
V2V can be used to communicate road conditions ahead of the driver's/vehicle's direct line of sight (e.g. a lane closure). The processed data about the sensed surroundings can be passed backwards in lines of vehicles so autonomous vehicles can plan their actions further in advance.
Further, autonomous driving is simpler when vehicles are communicating their intentions (e.g. an upcoming turn) because the vehicles can plan for other vehicles actions before they’re taken.
Although DIMO devices don’t yet equip V2V, it is a later step in a connected world. And vehicle agnostic connectivity with DIMO is a next step in the wider vehicle connectivity/connected world (contrasted to an OEM-specific communication).The future of the global fleet is mixed, and vehicles on the road today will need to be compatible with future technologies.
Proof of Location & Movement
As vehicles roll past each other, they can issue credentials to one another. This enables vehicles to not only share data, but create trust scores for one another based on how often it is issuing valid or invalid attestations. Similar to how physical trust works today, vehicles from different manufacturers may develop higher or lower trust scores based on their real world performance.
As most vehicles are close to one other vehicle at least once per day, the general area that vehicles are operating in can also be validated. Then, suspicious jumps in GPS locations can be identified as potential spoofing when a vehicle moves from an area with a high trust score to one with a low score.
Correlation Based Method
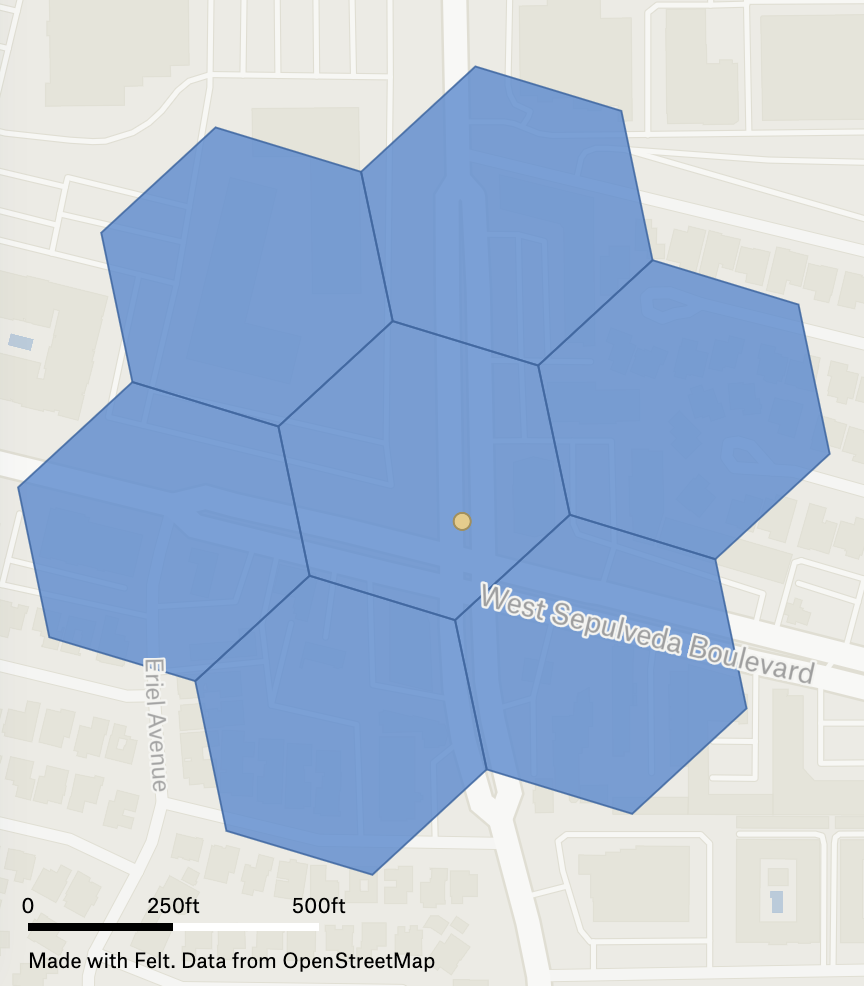
It can be a computationally massive problem to compare every GPS point to every other GPS point to find that two unique vehicles were close to one another. One solution without huge compute costs utilizes Uber’s H3 hexagon mapping of the world and sorting data in each hexagon by timestamp.
For every GPS coordinate, we find the h3 hexagon it lies in (the center one pictured), and then find the k-ring of hexagons surrounding it.
Then, all the GPS points that are in (or adjacent to) the visited hexagon are ordered by the timestamp. When a hexagon was visited by (or adjacent to) two unique vehicles where the gap between the timestamps is under 60 seconds, we assume the vehicles were close enough that they would have been able to communicate V2V.
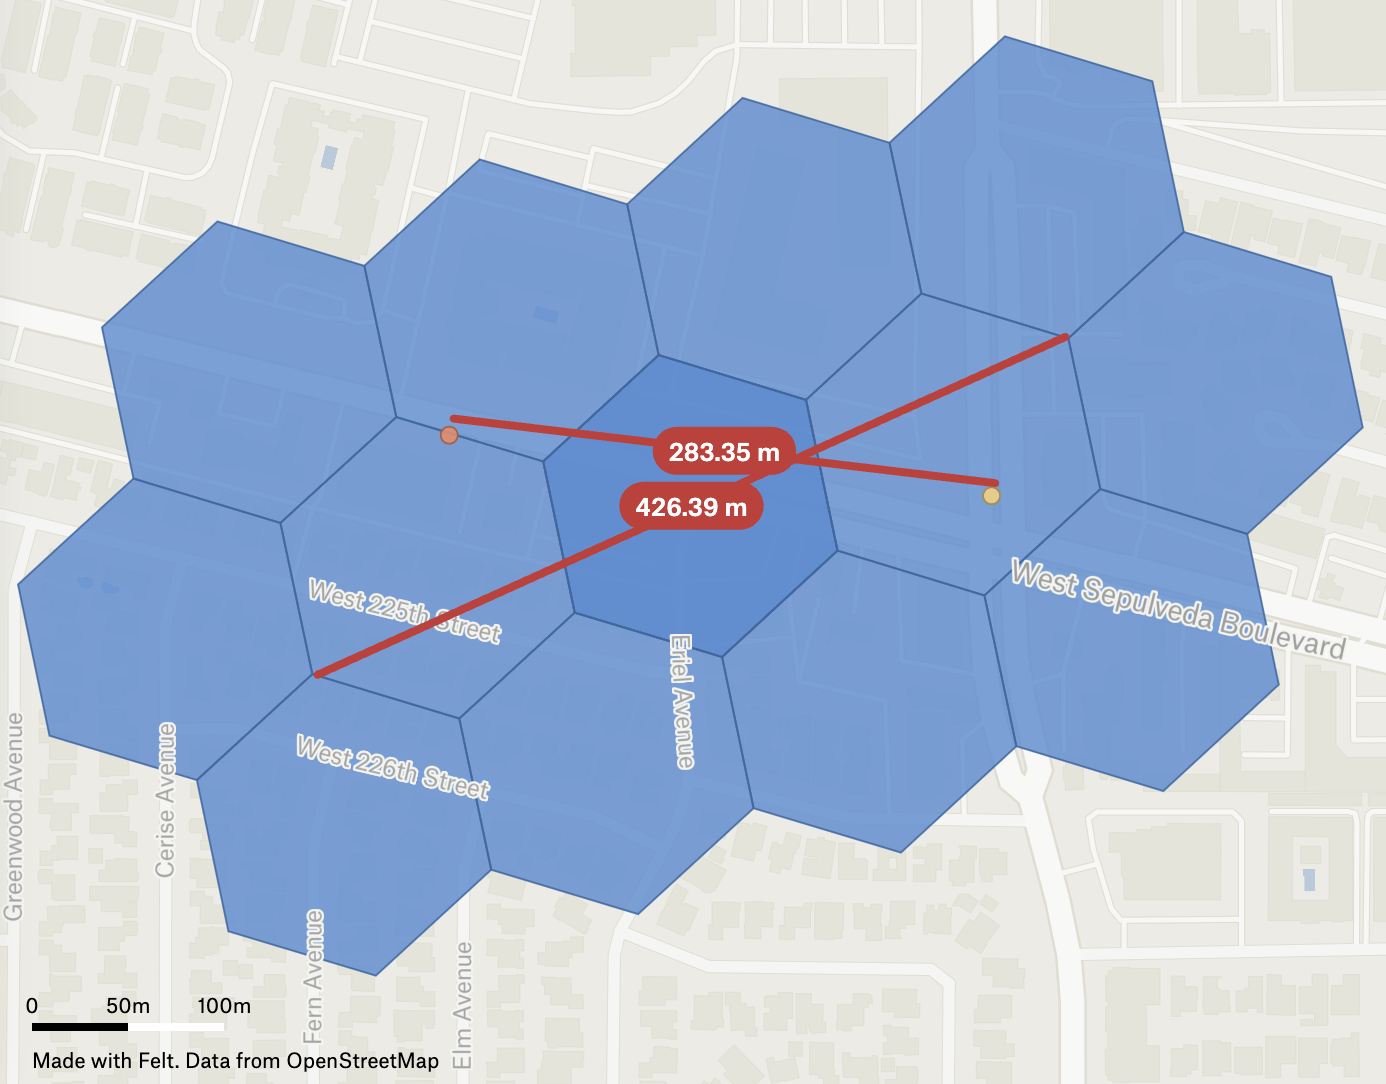
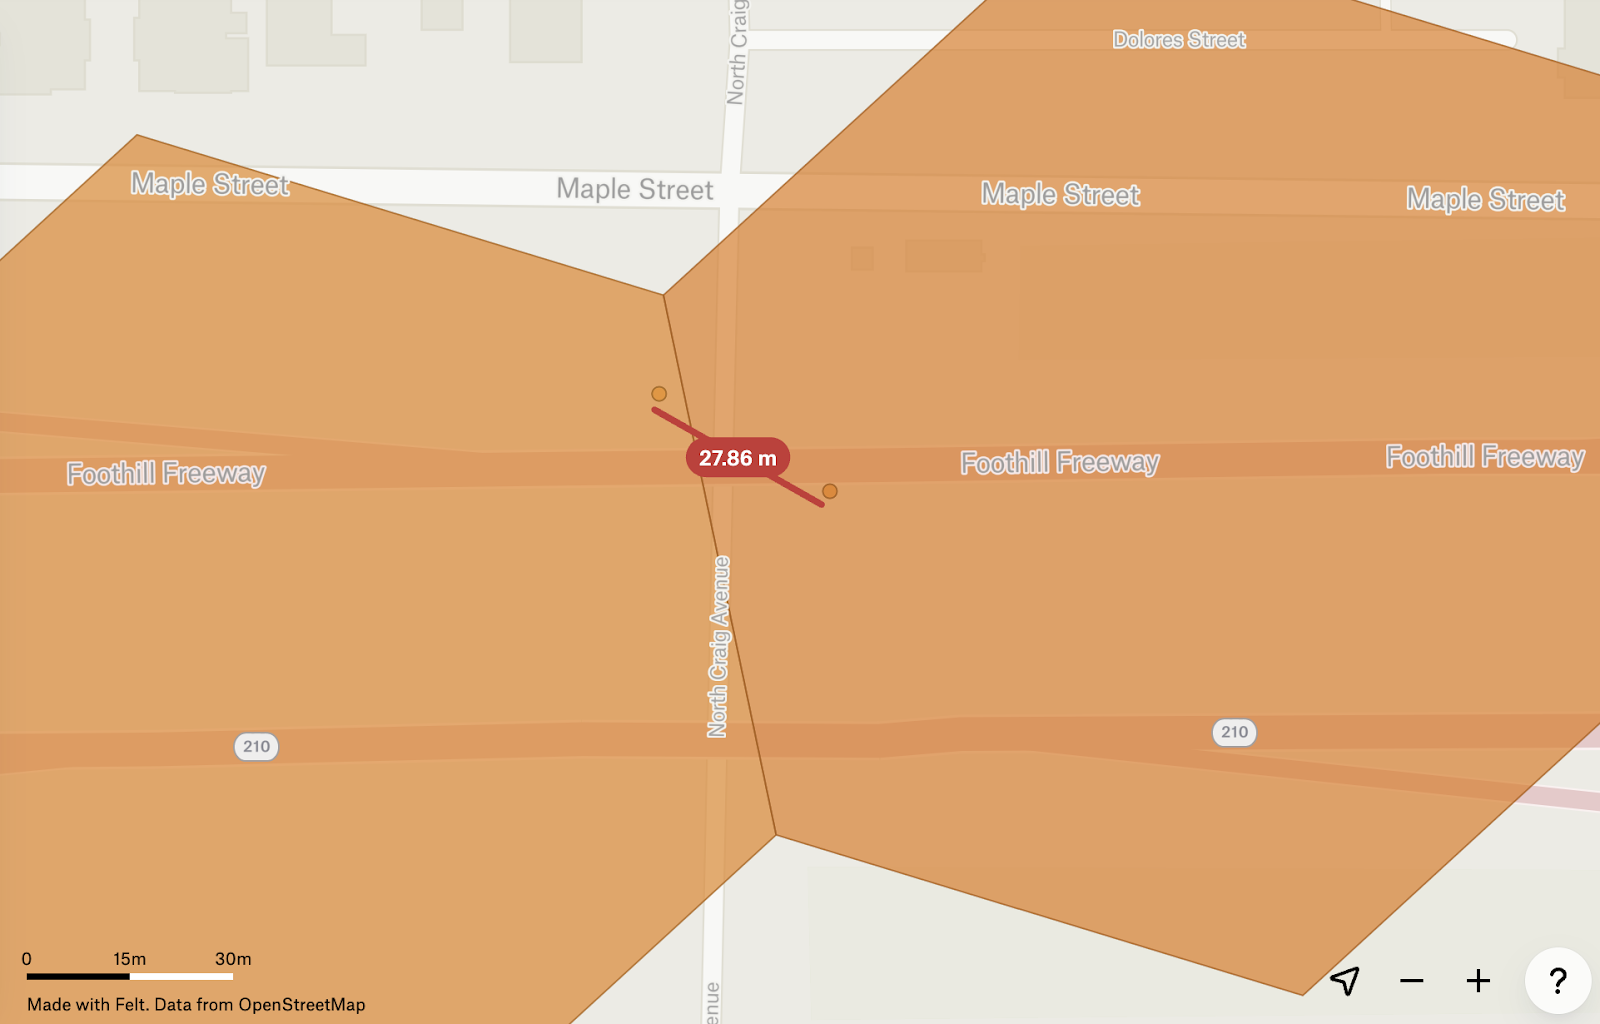
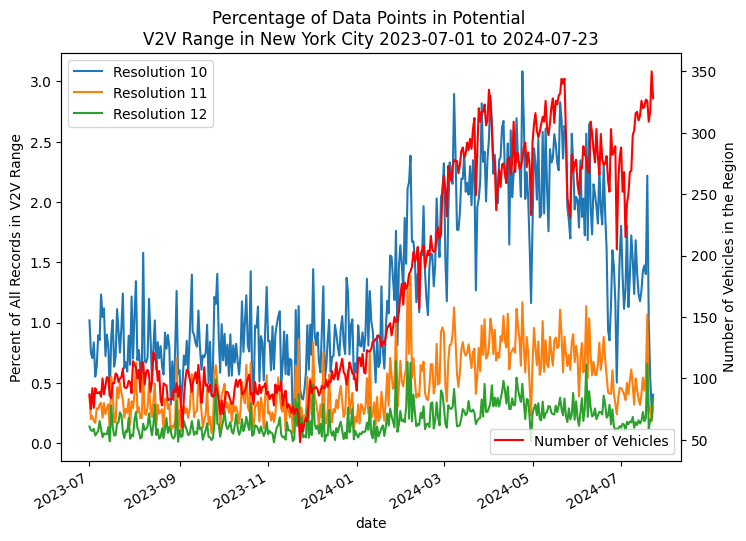
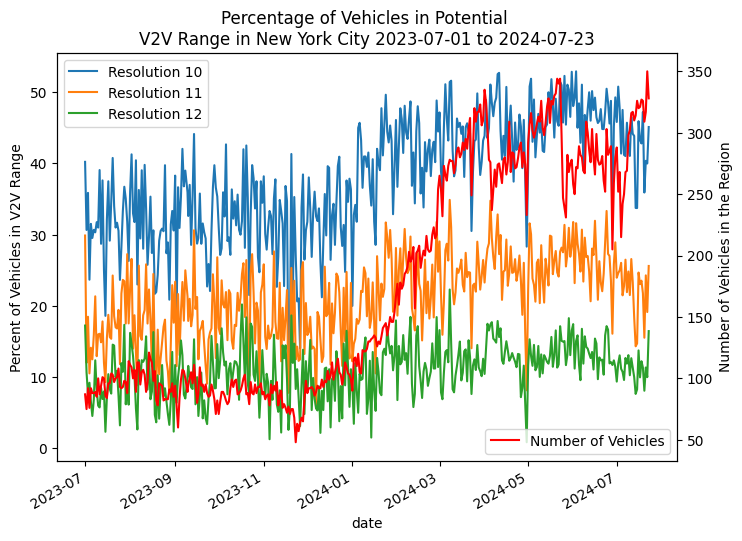
Hexagons at resolution 10 have a circumradius of about 76.104 meters. So the furthest two points can be is just under 6*76.104=456.624 meters. At resolution 11, the furthest is just under 172.59 meters, and at resolution 12, it is about 65.232 meters.
These hexagons allow us to set a threshold distance between two GPS points and find all “close” pairs of GPS points. This process avoids an O(N^2) comparison and allows the problem to be solved with an O(N*logN) sort of the data points by the timestamps.
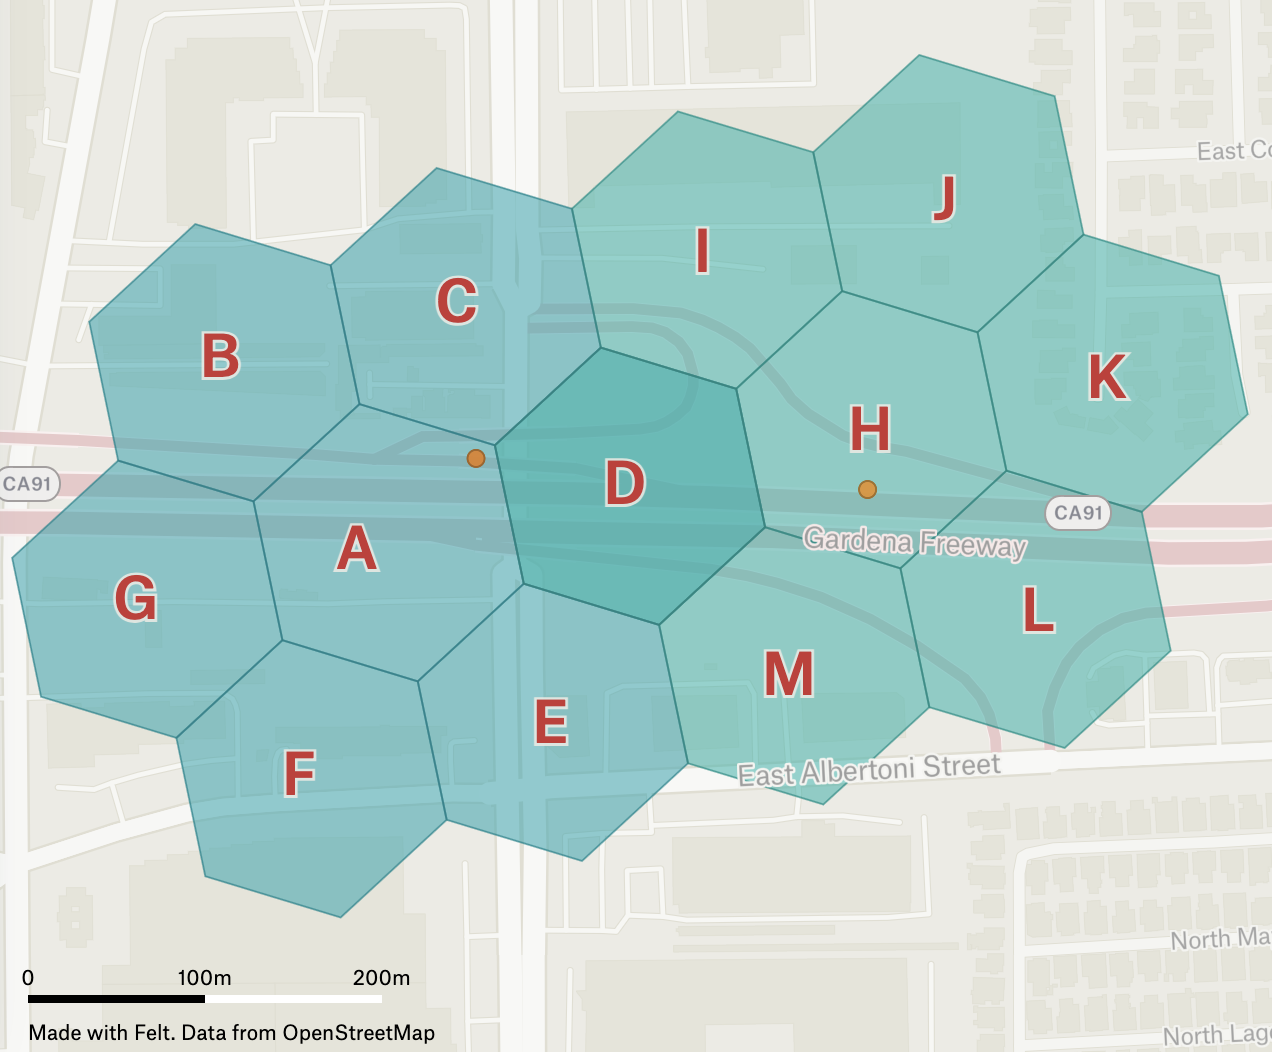
The table contains data points for the hexagons (and k-ring) in the image below. When the points are grouped by the hexagon id for each hexagon in the k-ring and then sorted by timestamp, we find that vehicles 1 and 2 share a hexagon in their k-ring (hexagon D) during hexagon visit ID X.
H3 Hexagon | K-ring | Timestamp | Vehicle ID | Hexagon Visit ID |
A | B | 12:00:00 | 1 | Z |
A | C | 12:00:00 | 1 | Y |
A | D | 12:00:00 | 1 | X |
H | D | 12:00:15 | 2 | X |
A | E | 12:00:00 | 1 | W |
A | F | 12:00:00 | 1 | V |
A | G | 12:00:00 | 1 | U |
H | I | 12:00:15 | 2 | T |
H | J | 12:00:15 | 2 | S |
H | K | 12:00:15 | 2 | R |
H | L | 12:00:15 | 2 | Q |
H | M | 12:00:15 | 2 | P |
A K-ring approach to detecting vehicles near each other reduces the possibilities of missed points. Once we employ this method we see these instances occurring as frequently as 1% of data points (resolution 11) and 25% of vehicles at least once per day in New York City.
Jeremy Lerner is a Senior Data Scientist consulting with DIMO. He helped design Ford's BlueCruise and has published several papers and patents on how to utilize connected vehicle data to understand drivers and improve the driving experience. Data-driven simulations are Jeremy's natural playground.